
A collection’s value is not fixed. If you hold coins with significant metal content, your portfolio moves with the market every day. Most collectors never see this movement clearly because they do not have a way to plot it.
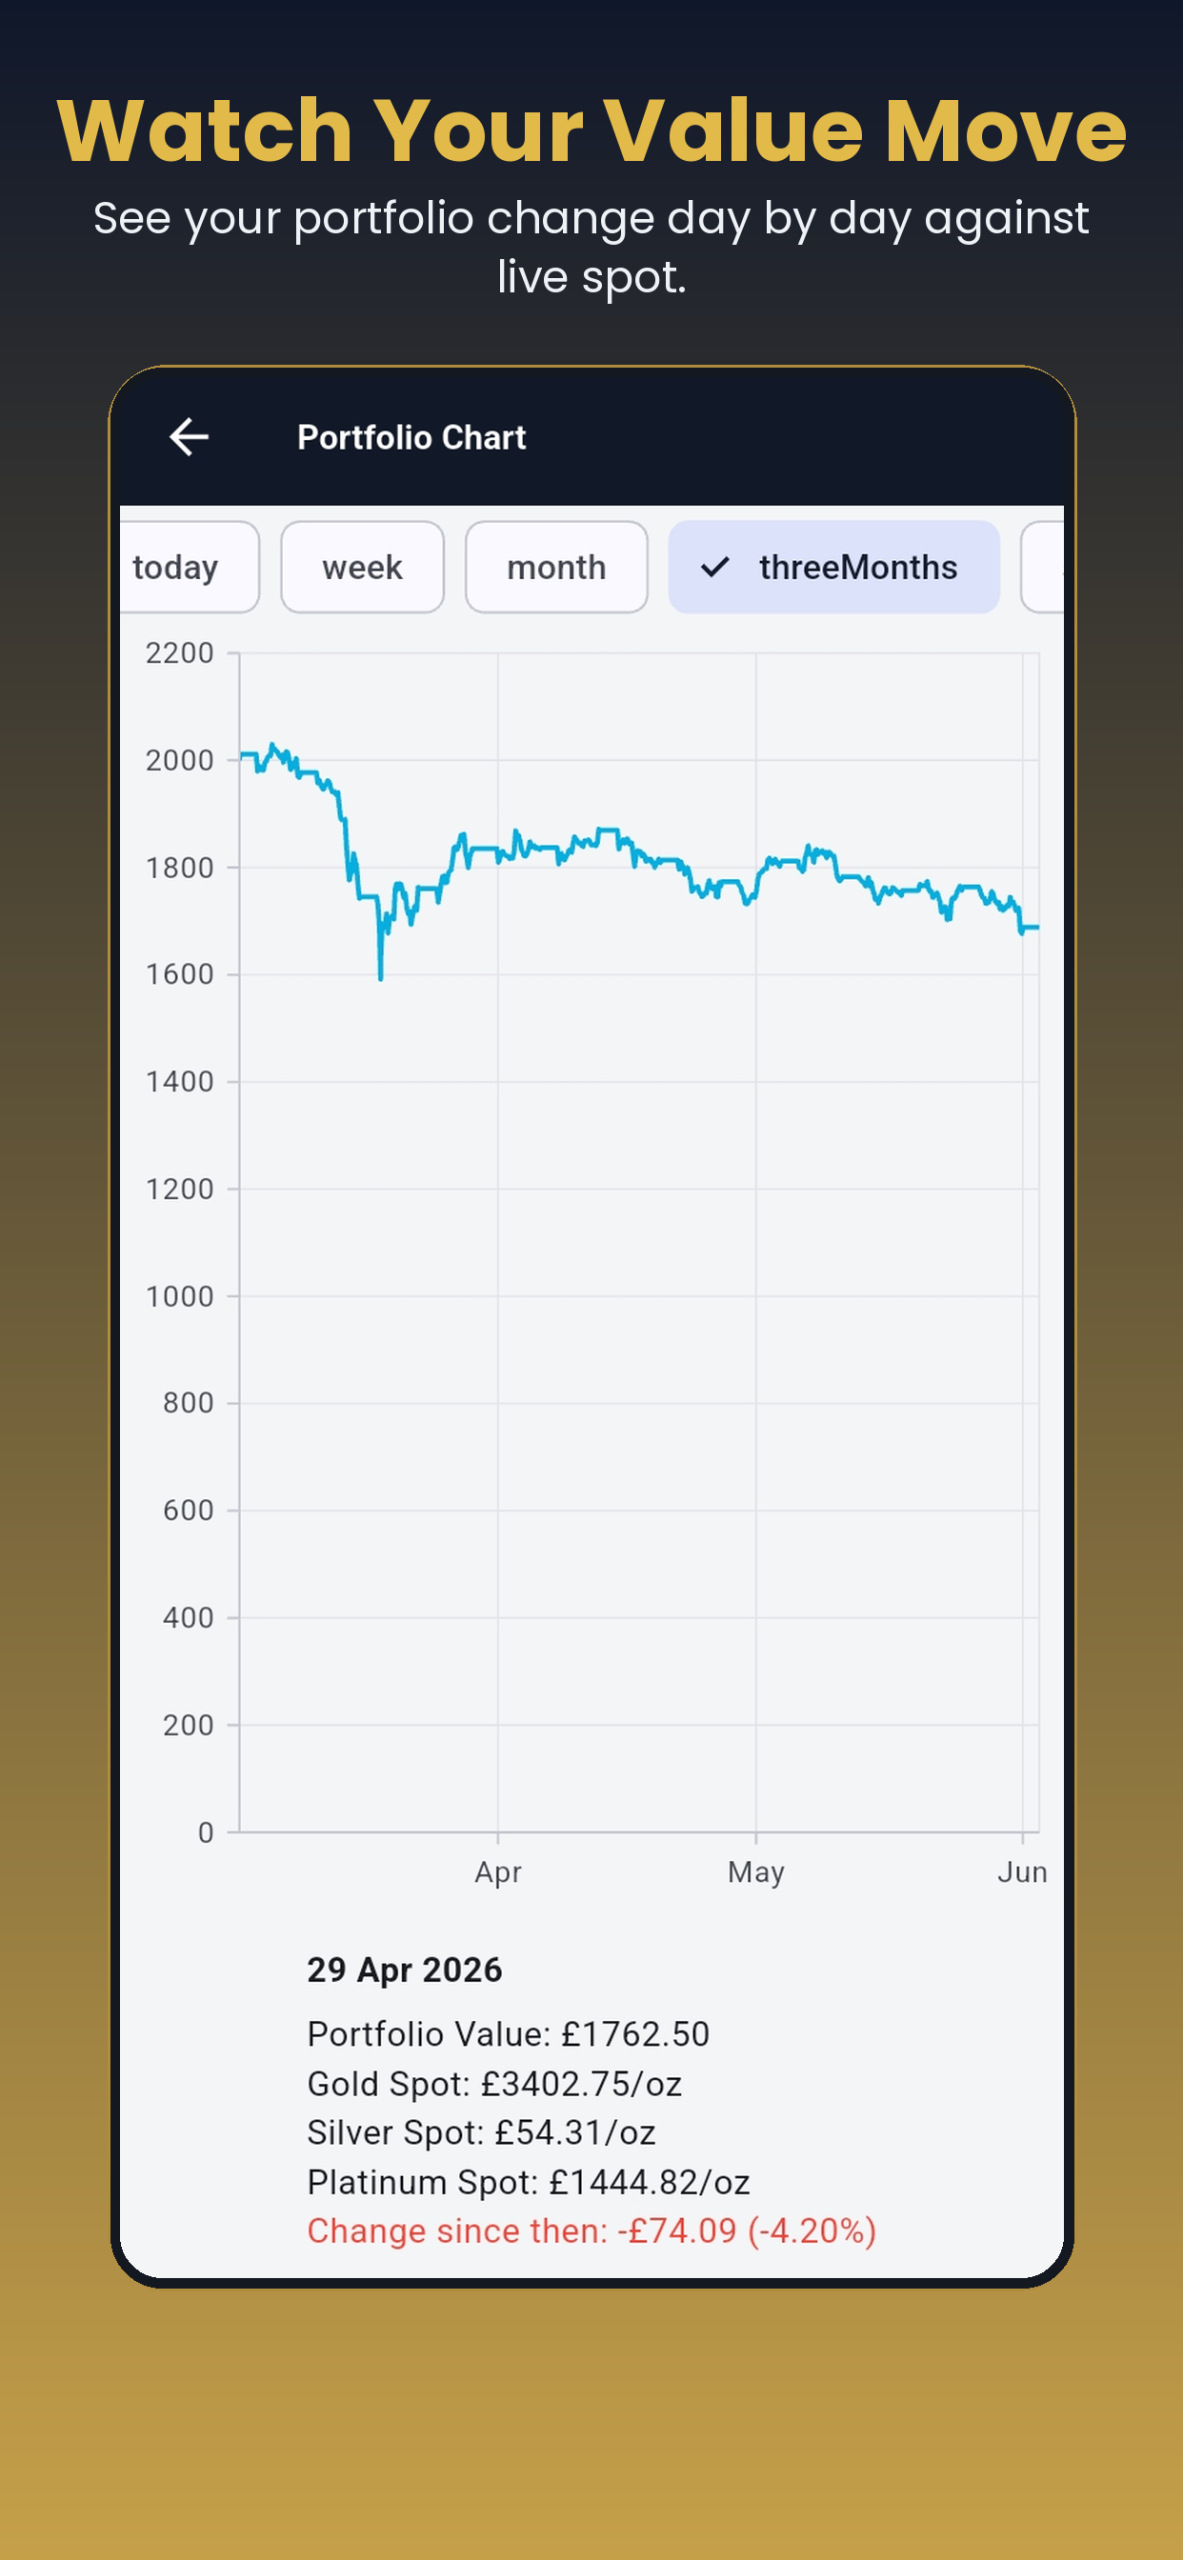
Chart your value over any timeframe
NumisTrack builds a chart of your total portfolio value plotted against time. You can view it over a single day, a week, a month, or three months. The chart updates as spot prices move, so you see your collection’s real-time value reflected in the line.
See the metal beneath the coins
The chart shows you which parts of your collection are sensitive to spot movement and which are not. A collection heavy in modern bullion or pre-decimal silver will show sharp moves when gold or silver shifts. A collection of rare dates and high-grade pieces will track more quietly. You watch the relationship between your coins and the market unfold.
Useful for understanding your holding
This is most useful if you hold a mix of collector pieces and metal-backed coins. The chart lets you see at a glance whether your collection is moving because the market is moving, or whether there is something else at work. It keeps you grounded on what you actually own and what drives its value day to day.
See everything NumisTrack does, or download the United Kingdom edition.